Leads generated by my AI systems
485 new leads a day by October, 4.3x the July pace. Every one captured, followed up and traced to its source by AI.
Results · my own portfolio
Every number on this page comes from businesses I own and run on AI. I pulled them straight from site analytics, Meta, my email provider and my lender partners’ records. I describe each site by its niche and leave the name off, because these are working assets and I’d like to keep them that way.
None of these businesses are clients. I’m showing you my own, because the honest way to judge someone who says AI can run your marketing is to look at what it runs for him.
Free, 30 minutes, phone or Google Meet.
Jon's own portfolio. Figures are from businesses Jon Dykstra owns and operates on AI. They are not client results. Data to Oct 11 2026 unless noted.

The portfolio, combined
In 2025 I went through my businesses one job at a time and asked a single question about each: can AI do this better, faster and cheaper than a person? When the answer was yes, AI got the job. Writing, images, social posts, ad launches, bidding, email, reporting and the analysis of what to try next all moved over.
This is what the portfolio looks like in 2026.
| Number | What it counts | Period |
|---|---|---|
| 46,800+ leads | Opted-in email subscribers plus home-equity lender leads | Jan 1–Oct 14 2026 |
| ~485 a day new leads | New leads per day in October, 4.3x the July daily pace | October 2026, to Oct 14 |
| 27.3M pageviews | All sites combined | Weeks of Feb 23–Oct 5 2026 (to Oct 11) |
| 20M+ website sessions | My two largest sites | Feb 16–Oct 11 2026 |
| 3M+ Facebook ad clicks bought by AI | My two largest sites | 2026, to Oct 11 |
| US$136K Facebook ad spend managed by AI | All sites; US$460 → US$19.8K a week (43x) | Feb 16–Oct 11 2026 |
| 1,878 ad campaigns launched by AI | 23 → 299 a week (13x) | Jun 22–Oct 11 2026 |
| 3,390 pages published | 35 → 145 a week (4.1x) | 2026; Jun 1 → week of Oct 5 |
| 4,184 social posts made by AI | 46 → 320 a week (7x) | Jun 22–Oct 11 2026 |
| 2.1M organic Facebook views | 6.5K → 1.24M a week (190x), 77 pages, organic only | Dec 29 2025–Oct 11 2026 |
A note on that last line, because I’d rather you hear it from me. In the final week, 91% of the organic Facebook views came from one page on one of my newer sites that went viral. The 190x is real, and it is lumpy. The steadier story is in the profiles below.
A “lead” on this site always means the same two things: a person who opted in to one of my email lists, or a home-equity lead delivered to a lender partner. They are not phone calls and they are not service jobs.
Leads generated by my AI systems
485 new leads a day by October, 4.3x the July pace. Every one captured, followed up and traced to its source by AI.
Jon's own portfolio. Figures are from businesses Jon Dykstra owns and operates on AI. They are not client results. Data to Oct 11 2026 unless noted.

How I watch my own businesses
Every chart on these pages comes out of the same habit: yesterday’s numbers, collected overnight, checked against their source and summarised before I’ve finished my coffee. If the totals don’t tie out, the report stops and tells me why instead of guessing. That discipline is why I trust these figures enough to publish them.
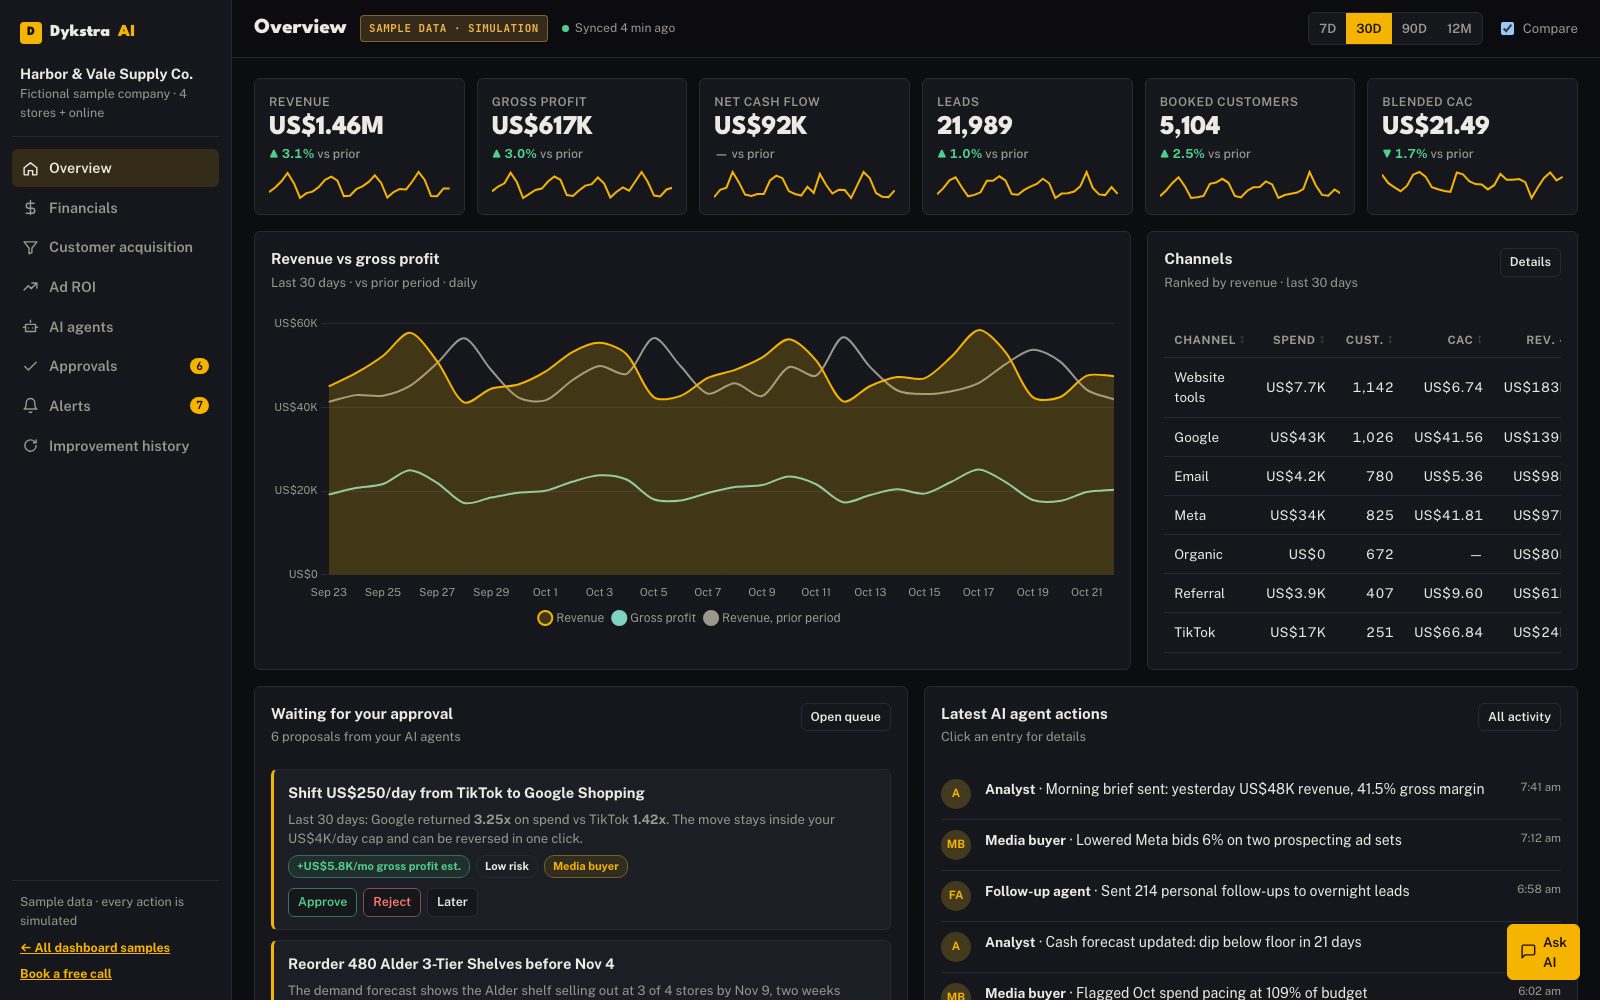
The executive command center demo shows what that reporting could look like for your business. It runs on a fictional company with sample data, and every button is a simulation.
Interactive demo with fictional sample data. Every action is simulated.
Sample data · click to explore
Proof it repeats · six weeks in
My two largest sites had a year of work behind them. The fair question is whether the system works when you drop it into a business cold. So I tested it on three smaller publishing sites in my portfolio: one about travel, one about vehicles and one about food.
The week of August 31, AI took over their content, their social media and their ad buying. Six weeks later, combined weekly sessions were 15x the week before the switch, and the latest week was 2.9x their best week since late July.
I show these three as multiples only. They’re small, young sites, and the shape of the growth is the useful part.
Jon's own portfolio. Figures are from businesses Jon Dykstra owns and operates on AI. They are not client results. Data to Oct 11 2026 unless noted. Growth is shown as multiples only for these newer sites.

Established businesses
Home improvement business2.4xweekly sessions since June, 20x organic Facebook reach, 24x ad spend managed by AI and 2,772 pages published in 2026See the results →
Owned
Fashion business2.9xweekly sessions since June, 2.8x pageviews, 19x pages published per week and 1.61M ad clicks bought by AISee the results →
Jon's own portfolio. Figures are from businesses Jon Dykstra owns and operates on AI. They are not client results. Data to Oct 11 2026 unless noted. The sites are described by niche, not named.
Client work
A client build for a plumbing company is underway now. It’s the same machine I run on my own businesses, rebuilt around booked jobs instead of email sign-ups.
When there’s enough data to mean something, I’ll publish the results here, measured the same way as everything else on this page: from the source systems, with the period and the denominator stated. Until then, I won’t quote a number for it.
Currently accepting a few more clients.
Book a free 30-minute call. You'll leave knowing exactly what AI should take over first in your business and what it should be worth to you.
Only a small number of businesses are taken on at a time.